
Tech Bubble vs. Housing Bubble, Which Will Burst First?
The stock market—in particular, technology stocks—continues to trade near record levels, and the U.S. housing market is closing in on record 2008 housing bubble levels. On the surface, technology stocks and the U.S. housing market appear to be in good shape, but nothing could be further from the truth.
Technology stocks and the U.S. housing market are both in bubble territory. This raises two big questions: tech bubble 2017 vs. U.S. housing bubble 2017, which will burst first? And of the inevitable bursting of the tech bubble vs. the popping U.S. housing bubble, which will be worse?
Advertisement

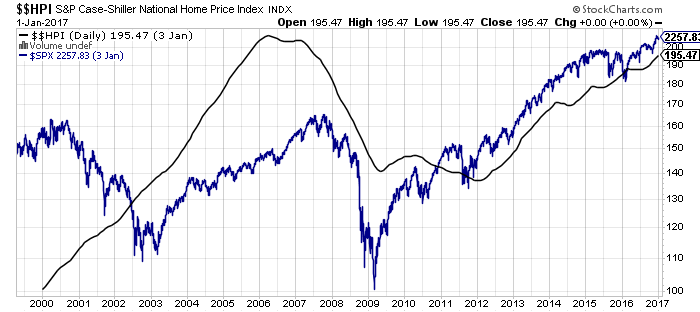
Chart courtesy of StockCharts.com
Recent history shows us that when a tech bubble bursts and the housing market collapses, the consequences are devastating. On March 10, 2000, the tech-heavy NASDAQ hit an all-time intra-day high of 5132.52; on October 9, 2002, the index bottomed at 1114.11, having lost 78% of its value and destroying $6.2 trillion in household wealth.
Five years later, the housing market crashed; from 2007 to 2009, homeowners lost $7.38 trillion when housing prices spiraled down 30% nationwide.
The loss of wealth, from the stock market crash and the bursting housing bubble, have been transformative for the United States. Not only did it ruin the middle class, it has changed the way people spend, save, and perceive the value of owning a home as opposed to renting.
Fast forward to 2017, and we’re back in a similar position: technology stocks and U.S housing are both in bubbles. We know that the markets are cyclical and that both of these sectors will eventually burst. Which is a greater risk for the U.S. economy in 2017?
U.S. Is in a New Housing Bubble
The U.S. housing market is on fire. Unfortunately, there’s no way to cool it down right now, and we’re in bubble territory again. A decade ago, the U.S. housing market bubble was stretched thin; too many houses were built and, thanks to faulty mortgage products, Americans were paying top dollar to climb the property ladder.
When the U.S. housing bubble finally burst, millions of Americans lost their homes and savings. Housing prices tanked 30%, but the loss to homeowners was much, much greater, because they were heavily leveraged.
Housing prices fell for six years, bottoming in July 2012. It has been all uphill since then; average annual national home prices have appreciated for approximately 60 consecutive months. The result: U.S. home prices have passed the record reached more than a decade ago. In March 2017, the median price of a home was up 7.5% year-over-year, at $273,000. Home sales advanced nine percent even though the number of homes for sale was down 13%.
How did we get here…again? History is repeating itself. The roots of the 2017 housing crisis can be traced back to the days of President George W. Bush.
President Bush believed that “if you own a home you have a vital stake in the future of our country.” Under Bush, the U.S. home ownership rate reached a record 69.2% in the second quarter of 2004. (Source: “Expanding Home Ownership,” The White House, last accessed April 13, 2017.)
To help foster home ownership, President Bush set a goal to:
- Increase the number of minority homeowners by 5.5 million families by 2010;
- Sign the American Dream Downpayment Act, which helped 40,000 families annually with their downpayment and closing costs;
- Propose the Zero-Downpayment Initiative to insure mortgages for first-time home buyers without a downpayment; and
- Propose $1.1 billion in direct loans for low-income borrowers unable to secure a mortgage through a conventional lender
While well intentioned, these easy taxpayer-subsidized lending practices helped bring about the 2007 housing bubble. Fast forward to 2017 and the U.S. housing market is again in a housing bubble that is at risk of bursting. Artificially low interest rates coupled with quantitative easing (QE) and an increased money supply has led to the bubble.
The idea that the government can help improve home ownership numbers in the U.S, at any cost, does not work.
That said, there are some subtle differences between the 2007 U.S. housing bubble and 2017 U.S. housing crisis. The main difference is that soaring housing prices are not being supported by faulty mortgage products that people cannot afford, and is instead being driven by a lack of supply (lowest in 20 years), strong demand, and artificially low interest rates that are still near record lows. Because of these factors, 2017 is shaping up to be the hottest housing market on record.

Again, first-time homebuyers are being faced with record high prices in many local markets, which pushed the median price of a home up 7.5% month-over-month in March to $273,000. At some point, stagnant wages and household debt (which is approaching pre-financial crisis highs) will come face-to-face with rising interest rates, and we all know how that ends.
At the beginning of 2017, before the Fed raised its key lending rate in March, 5.3% of mortgages were delinquent by at least 30 days. The number of mortgages in some state of the foreclosure process was 0.8%; the number of early-stage delinquencies (30–59 days past due) was 2.1%; and the serious delinquency rate (90 days or more past due) was 2.5%. These numbers are bound to rise as the Fed continues to raise rates in 2017 and 2018. (Source: “CoreLogic Analysis Shows 5.3 Percent of Homeowners Were Late With Their Mortgage Payments In January 2017,” The Wall Street Journal, April 11, 2017.)
The U.S. real estate forecast for 2017 remains strong. But there is nothing to fuel the fire. Rising housing prices can only climb higher and, at the very least, be supported, if the U.S. economy continues to create jobs, wage growth keeps up with rising housing prices, and Americans are able to save for a downpayment and life in general.
None of this is in place. Most of the jobs created in the U.S. economy since the markets bottomed in 2009 have been low-paying, part-time jobs that offer little to no security. Moreover, wage growth is glacial; it’s not even keeping up with inflation, let alone skyrocketing housing prices. U.S. households are holding near-record levels of debt and have little to no savings.
Homeowners facing foreclosure, or those who are severely in debt and will be facing foreclosure when interest rates rise, will find little solace in discovering that the 2017 housing bubble is different than the 2007 housing bubble. In the end, when prices tank, they’ll find that all the equity in their home has vanished, and some will be holding mortgages worth more than the value of their home.
Tech Bubble 2017
U.S. housing prices have erased the losses from the 2007 bursting housing bubble. The same kind of euphoria is sweeping technology stocks. The NASDAQ is 15% above its 2000 dotcom bubble highs and continues to trade near record levels. But the euphoria around the Donald Trump presidency has pushed technology stocks to unsustainable levels; ones that echo the tech bubble of 2000.
Like the 2017 housing bubble crisis, a little history is needed when looking at the 2017 tech bubble.
The 2000 Tech Bubble Explained
The tech bubble that formed in the late 1990s and peaked in 2000 was a result of unbridled optimism about the untold riches that would come from the newly adopted Internet.
From 1995 to March 2000, investors poured money into technology companies that were founded on seemingly great ideas but had no business strategy. Management teams burned through money to grow their businesses and needed to take them public to make even more money.
Investors, afraid of missing out on the next big thing, poured their money into each and every technology initial public offering (IPO). In 1999, at the frenzied height of the tech bubble, 457 companies went public, and most of them were technology stocks. Of those, 117 doubled in price on the first day of trading.
Investors didn’t care if a tech stock wasn’t making money, had tons of debt, and nothing to show for it. Investors were betting on potential, and they only paid attention to momentum and technicals.
And it paid off. At first. From January 1995 to March 2000, the NASDAQ soared 682% from 751.49 to 5,132.52. Then, for no reason, with no warning, technology stocks started to sell off. Analysts said it was just a short-term correction. It wasn’t. Investors realized they were holding onto technology stocks that were essentially worthless. Technology stocks that were once worth billions of dollars were worth nothing. By October 9, 2002, the NASDAQ had lost 78% of its value.
It took 15 years for the NASDAQ to surpass those lofty heights. Investors are certain that the 2017 tech bubble is different from the 2000 tech bubble. But is it?
Tech Bubble 2017
Are we in a second tech bubble? Technology stocks have been, like the broader market, bullish since bottoming in March 2009. After taking a breather in 2015, technology stock resumed their ascent in 2016, only to pause again in the lead-up to the U.S. election. Investors were worried what a Trump presidency would do to technology stocks.
On the campaign trail, Trump promised to create U.S. jobs, which was bad news for tech stocks, since tech companies make most of their parts overseas. It didn’t help that Trump said, “We’re going to get Apple to build their damn computers and things in this country instead of in other countries.” Moreover, Trump said he would hit U.S. tech companies that export jobs with huge tariffs. (Source: “Trump: Apple should build ‘their damn things’ in US,” CNBC, January 19, 2016.)
That apprehension quickly disappeared after Trump won the U.S. election. Wall Street decided that Trump’s proposed tax plans, fewer regulations, and renegotiated trade deals would be good for tech companies.
The NASDAQ rebounded, closing out the year up seven percent from November lows. The momentum carried into 2017; the NASDAQ advanced nine percent in the first quarter of the year and hit a record intra-day high of 5,936 in early April. This put the NASDAQ 16% higher than its pre-2000 tech stock meltdown.
Just like in 2000, investors are casting fundamentals aside, afraid to miss out on any gains. But has the tech bubble peaked? Probably not. Investors are happy to give Trump some time to prove whether he can achieve his campaign promises. If he is successful in getting tax cuts through, or cutting red tape, or renegotiating trade deals, the NASDAQ will climb to new record levels. But, if Trump faces gridlock or roadblocks, like he did with his healthcare plan, stocks will retrace.
Until then, investors will take a wait-and-see approach to the Trump administration. Until there is any movement, it’s important to remember that the U.S. reported anemic 2016 gross domestic product (GDP) growth of 1.6%, and the S&P 500 only recently emerged from the longest earnings recession on record. While Wall Street is bullish on 2017 earnings, U.S. GDP is not expected to move much higher over the next few years.
Still, the broader markets are at record levels. Why? Income-starved investors, who have had their retirement savings decimated by artificially low interest rates, have moved on to riskier avenues like the stock market. Since 2009, it hasn’t mattered whether companies were making money; investors were happy to invest and see stock valuations climb regardless.
Following technicals and momentum has sent tech stock valuations, and valuations of the broader market, to unsustainable levels. The levels are very similar to the tech bubble of 2000. The bull market may be eight years old, but stocks are overvalued, and 2017 could be the year that the tech bubble bursts.
According to the cyclically adjusted price-to-earnings (CAPE) ratio, the S&P 500 is overvalued by 81%. The ratio, which helped Yale professor Robert Shiller win the Nobel Prize for Economics in 2013, compares current prices to average earnings over the last 10 years. The ratio is currently at 28.94; the long-term average is 16. The CAPE ratio has only been higher twice: in 1929, it was at 30 and in 1999, it was at 45. (Source: “Online Data Rober Shiller,” Yale University, last accessed April 13, 2017.)

The Case-Shiller ratio is not a crystal ball that predicts or times a stock market crash, but it does show that, when stock valuations get to these frothy heights, it never ends well.
A rising tide might lift all boats, but the boats also do the opposite when the tide reverses. The same goes for technology stocks. The bullish environment has helped many undeserving tech stocks ride the momentum of great tech stocks.
A bursting of the tech stock bubble in 2017 will help separate out the wheat from the chaff. At the same time, great technology stocks will also experience a correction. Not all technology stocks are being propped up by artificially low interest rates and optimism.
When the tech bubble will burst is anyone’s guess, only because with most sell-offs there is little fanfare, just like in March 2000, when tech stocks peaked then quietly started to retrace. But, just like the bursting housing bubble, we all know how it will end.
Tech Bubble vs. Housing Bubble, Which Is Worse?
Which puts the U.S. at greater risk, a tech bubble or a housing bubble? They’re both disastrous. When the 2000 tech bubble burst, $6.2 trillion was wiped from U.S. household wealth. When the U.S. housing bubble burst, homeowners lost a similar amount.
Economists and your local real estate agent will tell you that home sales will trend higher throughout 2017 as the number of existing single-family homes for sale dwindle and home builders struggle to keep up with the demand for new homes.
U.S. Housing Crisis 2017
Housing prices may be at record levels, but the price increases are seriously outpacing wage growth. And cash-strapped first-time home buyers are being priced out of the market.
In February 2017, first-time home buyers, which is a benchmark statistic for how well the U.S. economy is doing, accounted for just 32% of all purchases, down from 33% in January. The 30-year average—a number that economists consider healthy—is 40%. First-time home buyers accounted for 32% of all existing home sales in 2016. (Source: “Existing-Home Sales Stumble in February,” National Association of Realtors, March 22, 2017.)
Moreover, rising interest rates will start to be a burden for many cash-strapped homeowners. This could be a huge drag on the U.S. economy in 2017. Housing’s combined contribution to U.S. GDP averages 15%–18%. (Source: “Housing’s Contribution to Gross Domestic Product (GDP),” National Association of Home Builders, last accessed April 13, 2017.)
The combination of rising interest rates and falling housing prices will leave homeowners with bad investments they cannot afford. The government-assisted, easy-money lending practices, which were aimed at helping Americans get on the property ladder, have, as we have seen, unintended consequences which can burden one-time property owners for life.
We can see the U.S. housing market bubble forming, and we know it will eventually burst. Another thing we know is that the U.S. housing market never recovers quickly. Getting back to normal never happens for many Americans.
Tech Stock Crisis 2017
Just like the bursting housing bubble, the consequences of the tech bubble are real too. Again, we know what caused the tech bubble; investors were afraid to miss out on gains and kicked fundamentals to the curb in favor of technicals and momentum. But we don’t know why tech stocks peaked when they did, nor why the sell-off began when it did. Nothing out of the ordinary happened. It just started to snowball.
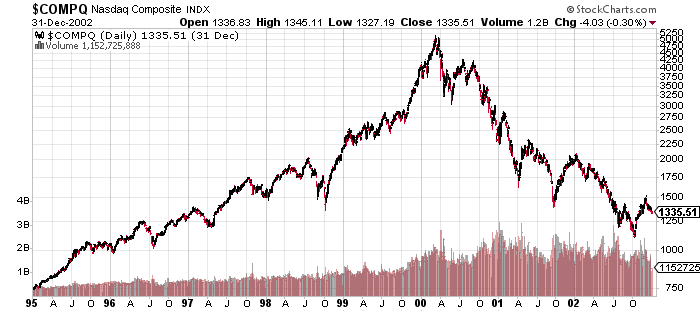
Chart courtesy of StockCharts.com
The effects of the bursting tech bubble were felt on Wall Street and Main Street. Several tech companies that were once valued in the billions of dollars went bankrupt.
WorldCom admitted billions of dollars in accounting errors. Pets.com, theGlobe.com, and WebVan couldn’t make their business models work. Others were acquired or merged. At the same time, some companies streamlined operations and/or changed direction and thrived, like Amazon, eBay, and Priceline.
While some up-and-coming tech CEOs may have had to move back into their parents’ basements after the tech bubble burst, it was worse for Main Street. As previously noted, the NASDAQ plunged 78% when the tech bubble burst; $6.2 trillion in wealth vanished. To put that into perspective, U.S. GDP in 2000 was $10.28 trillion.
Stock bubbles are damaging. Not only can investors lose everything, bursting bubbles are followed by a recession and slow recovery. This is compounded when the economic recovery is followed by both above- and below-average growth, like we are experiencing now.
The bull market may be in its eighth year, and stocks are at record levels, but the U.S. recovery, which started under the Barack Obama administration, is the slowest economic recovery since 1949, increasing just 2.1% since 2009. The economic recovery under George W. Bush averaged 2.7%. Under President Bill Clinton, average annual GDP growth during the recovery was 3.5%. (Source: “Economic Growth Slower Than Previous 10 Expansions,” Congressional Research Service, June 30, 2016.)
Since World War II, the S&P 500 has gone through 15 bear markets. On average, the bear markets lasted around one year, with stocks falling approximately 30%. It takes a lot longer to make up that lost ground. After the 2000–2002 bear market, it took 68 months for the S&P 500 to reach its previous peak. After the financial crisis, bursting tech bubble, and recession, it took the S&P 500 53 months to recover.
Which is worse, a bursting tech bubble or a popping housing bubble? When it comes to the U.S. economy and U.S. households, they’re equally calamitous.